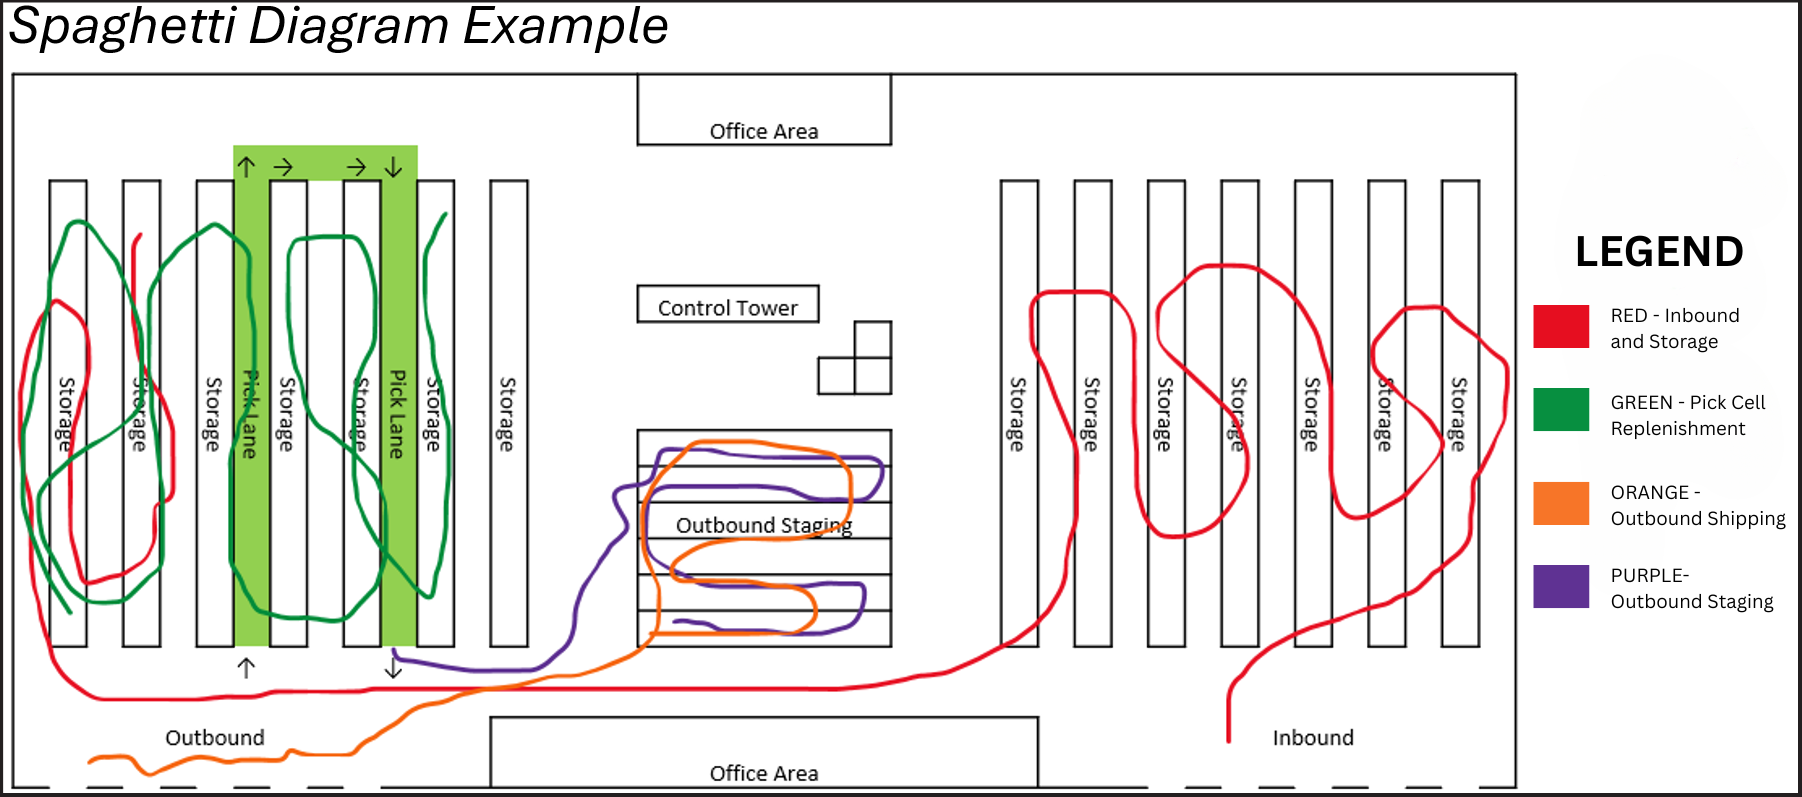
What is a Spaghetti Diagram?
Spaghetti Diagrams in Warehousing & Distribution Flow
A Visual Tool to Reduce Waste and Improve Efficiency
What is a Spaghetti Diagram?
A Spaghetti Diagram is a lean tool used to visualize the flow of people, products, or information through a process or facility. Named for its resemblance to tangled spaghetti noodles, the diagram highlights inefficient movement and unnecessary travel paths in a workspace.
Purpose in Warehousing & Distribution
In warehouse and distribution environments, Spaghetti Diagrams are used to:
- Map the current flow of materials, workers, or forklifts.
- Reveal inefficiencies caused by layout design or process steps.
- Identify opportunities to shorten travel distances and streamline operations.
- Support continuous improvement and lean initiatives.
Common Uses:
- Tracking how far pickers travel during order fulfillment
- Analyzing forklift paths for staging and loading
- Studying the path of a product from receiving to shipping
- Visualizing operator movements at packing or kitting stations
How to Create One:
- Choose a process or area – e.g., order picking or shipping.
- Observe and record actual movement (don’t rely on SOPs).
- Draw lines over a facility layout to represent the paths taken.
- Analyze for waste – look for loops, backtracking, excessive travel.
- Redesign – propose layout or process improvements to reduce movement.
Benefits:
✔ Improves layout design for better flow
✔ Reduces motion waste and walking time
✔ Enhances safety by minimizing cross-traffic
✔ Leads to faster throughput and lower labor costs
Key Tip:
Combine Spaghetti Diagrams with time studies to fully understand the cost of inefficient movement and justify changes.
